

Texas is full of fun-loving folks; they are kind, big-hearted, and ready to give you the shirt off your back, should you only ask nicely. However, in all honesty, we have to admit that not everyone lives up to those Texans’ high standards. Where do those who fail to meet that criteria live? In other words, what are the most dangerous cities to live in Texas?
In this article, that’s what we’ll be reviewing. However, before jumping into the list, we’ll need to discuss what is generally classified as “dangerous” and how that applies to the cities and towns we’ll be listing later.
Criteria for “Dangerous” Cities in Texas
For the purposes of this article, an area that is considered “dangerous” is one that has more cases of violent crime. A “violent crime” is defined by the FBI as a form of homicide, rape, armed robbery, or assault.
21 Most Dangerous Cities to Live in Texas
The following are some of the most dangerous towns and cities to live in Texas, according to FBI crime data gathered by Safewise in July 2020. These areas were selected based on population size (5,000+ people), and the ratio of violent crimes to the total population. They were not considered based on their property crime levels except where violent crime levels were the same.
Bellmead
Bellmead ranks as the number one dangerous town in Texas on our list. With a small population of only 10,587 people, Bellmead had a whopping 12.9 violent crimes per 1,000 people. Data USA shows Bellmead has an average household income of $37,966 and an average age of 33.3 with a poverty rate of 26.6%.
Pecos
Pecos has a population of 10,094 and experienced 12.3 violent crimes per 1,000 people. Pecos has an average household income of $54,967, an average age of 35.3, and a poverty rate of 11.8%.
Hempstead
Hempstead has a population of 7,969 and experienced 10.9 violent crimes per 1,000 people. Hempstead has an average household income of $34,415, an average age of 23.8, and a poverty rate of 35.5%.
Beaumont
Beaumont has a population of 119,368 and had 10.6 violent crimes per 1,000 people reported. Beaumont has an average household income of $45,268, an average age of 34.3, and a poverty rate of 19.7%.
Bastrop
Bastrop has a population of 9,050 and had reports of 10.4 violent crimes per 1,000 people. Bastrop has an average household income of $52,850, an average age of 41.3, and a poverty rate of 11%.
Houston
Houston has a population of 2,344,966 and experienced 10.3 violent crimes per 1,000 people reported. Houston has an average household income of $51,203, an average age of 33.1, and a poverty rate of 21.2%.
Lubbock
Lubbock has a population of 257,372 and had a reported 10.0 violent crimes per 1,000 people. Lubbock has an average household income of $47,326, an average age of 29.4, and a poverty rate of 19.8%.
Raymondville
Raymondville has a population of 10,959 and had 9.7 violent crimes reported per 1,000 people. Raymondville has an average household income of 23,281, an average age of 33.2, and a poverty rate of 41.5%.
Levelland
Levelland has a population of 13,646 and experienced 9.1 violent crimes per 1,000 people. Levelland has an average household income of $45,960, an average age of 32.8, and a poverty rate of 15.2%.
Humble
Humble has a population of 16,122 and had a reported 9.0 violent crimes per 1,000 people. Humble has an average household income of $38,961, an average age of 33.1, and a poverty rate of 17.3%.
Paris
Paris has a population of 24,736 and had 8.8 violent crimes per 1,000 people reported. Paris has an average household income of $32,737, an average age of 39.1, and a poverty rate of 23.8%.
Odessa
Odessa has a population of 119,545 and experienced 8.8 violent crimes per 1,000 people. Odessa has an average household income of $61,541, an average age of 30.6, and a poverty rate of 11.8%.
Amarillo
Amarillo has a population of 201,082 and had a reported 8.1 violent crimes per 1,000 people. Amarillo has an average household income of $51,198, an average age of 33.7, and a poverty rate of 16.4%.
Fort Stockton
Ft. Stockton has a population of 8,365 and had 7.8 violent crimes per 1,000 people reported. Fort Stockton has an average household income of $42,492, an average age of 35.6, and a poverty level of 11.6%.
Corpus Christi
Corpus Christi has a population of 328,614 and reportedly had 7.6 violent crimes per 1,000 people. Corpus Christi has an average household income of $56,602, an average age of 35.3, and a poverty rate of 16.2%
Dallas
Dallas has a population of 1,362,465 and experienced 7.6 violent crimes per 1,000 people. Dallas has an average household income of $52,210, the average age of 33.3, and a poverty rate of 21.8%.
Converse
Converse has a population of 24,185 and had 7.1 violent crimes per 1,000 people reported. Converse has an average household income of $64,481, an average age of 31.0, and a poverty rate of 8.4%.
Balch Springs
Balch Springs has a population of 25,565 and reportedly had 7.0 violent crimes per 1,000 people. Balch Springs has an average household income of $45,308, an average age of 26.9, and a poverty rate of 21.7%.
Port Arthur
Port Arthur has a population of 55,643 and experienced 7.0 violent crimes per 1,000 people. Port Arthur has an average household income of $32,571, an average age of 33.6, and a poverty rate of 30.7%.
Seminole
Seminole has a population of 7,725 and had 6.7 violent crimes per 1,000 people reported. Seminole has an average household income of $49,844, an average age of 30.8, and a poverty rate of 9.4%.
Alamo
Alamo has a population of 19,840 and reportedly had 6.6 violent crimes per 1,000 people. Alamo has an average household income of $36,239, an average age of 31.1, and a poverty rate of 29.3%.
To learn more about how other cities stack up in danger/safety rates, like Austin, check out our article here.
If you’re concerned about your safety, She’s Birdie carries a personal alarm keychain.
What Makes These Cities Dangerous?
You may have noticed that as well as violent crime data, we also mentioned the town or city’s average income, age, and poverty rate; this is because numerous theories and studies try to correlate these factors to an area’s overall “danger” level. Let’s look at how each affects the violent crime levels in each city we discussed.
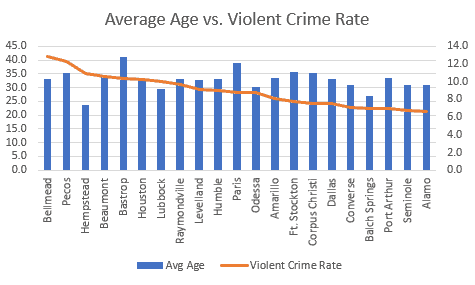
Age
As you can see, there is little relationship shown between age and the number of violent crimes reported in the dangerous cities we have identified.
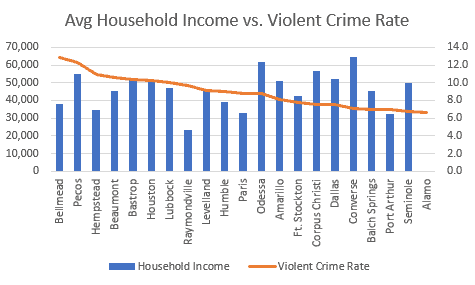
Average Household Income
There is a much stronger relationship shown between average household income and violent crime rates. As you can see, as income goes up, violent crime rates tend to go down.
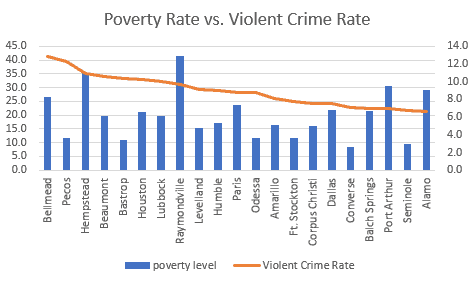
Poverty Rates
Surprisingly, there is minimal relationship showing between the poverty rate and violent crime rate.
Final Thoughts
Whether the root cause(s) for an incidence of violent crime is economical, sociological, cultural, or a combination of all three, it is clear that our towns and cities are not always the bastions of safety we would hope for. Keeping a careful watch for ourselves and our neighbors is probably the best protection we all have against those with impure intentions.


